For decades, the embedded engineering world has relied on a handful of metrics as the primary indicators of system health: Code Coverage and CPU Load. These are essential, foundational measures, telling us how much of our code is being tested and how busy the main processor is. But in the age of highly complex, connected, and safety-critical systems—from advanced driver-assistance systems (ADAS) to industrial IoT—these traditional metrics are no longer sufficient.
True engineering excellence and project predictability demand a deeper, more sophisticated metrics toolkit. We need metrics that quantify firmware quality, real-time determinism, resource efficiency, and team velocity. The shift is away from simply measuring activity toward measuring value and risk.
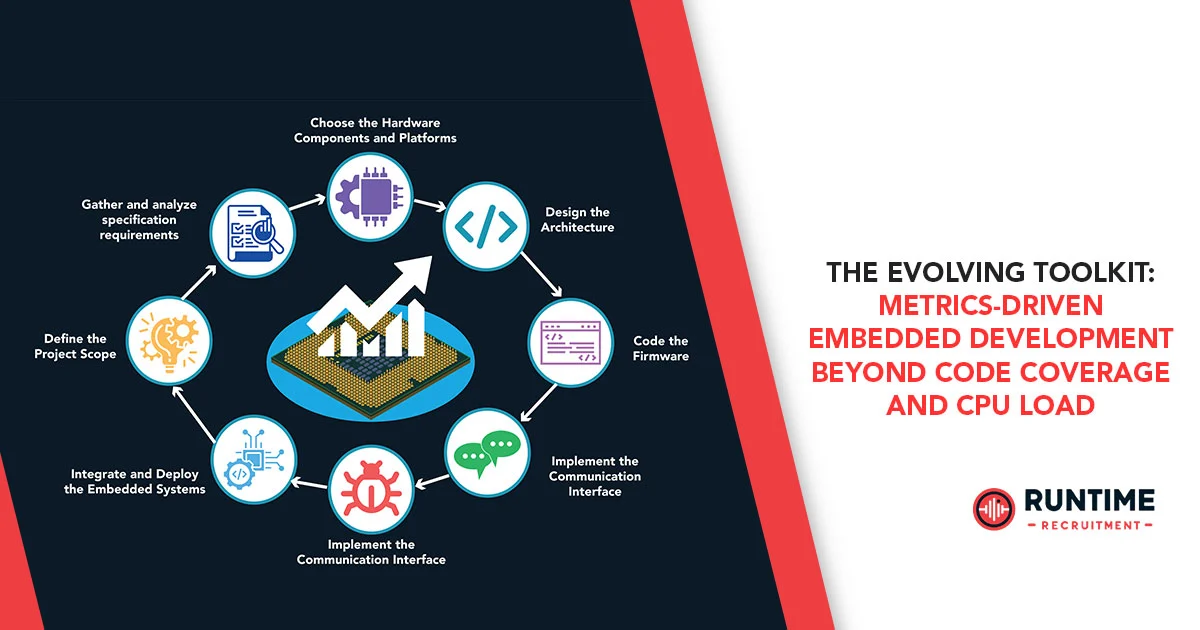
This in-depth guide is for the modern embedded engineer and technical lead looking to evolve their development process into a data-driven powerhouse.
Phase I: Beyond The Core – Firmware Quality and Reliability Metrics
If code coverage is a measure of testing quantity, then the following metrics are measures of testing and code quality. They quantify the reliability and maintainability of the finished product.
1. Defect Density (DD) & Defect Removal Efficiency (DRE)
A high code coverage percentage is meaningless if the covered code is an unreadable, tightly coupled mess. Defect metrics offer a clear, objective view of internal quality.
- Defect Density (DD): The number of confirmed defects (bugs) per thousand lines of non-comment source code (KLOC).
DD=KLOCTotal Defects Found- The Embedded Relevance: Embedded systems often run on limited memory and processing power, making every defect more impactful. A high DD indicates a risky codebase that is likely to consume excessive resources during maintenance and bug fixing. An ideal range is often cited below 1–3 defects per KLOC, but this is highly context-dependent.
- Defect Removal Efficiency (DRE): The percentage of defects found by the development team before the product ships to a customer (or enters a production environment).
DRE=Defects Found Internally+Escaped DefectsDefects Found Internally- The Embedded Relevance: For safety-critical systems (e.g., medical devices, automotive), a DRE approaching 100% is the goal. A low DRE suggests fundamental flaws in your verification, unit testing, and integration testing processes, meaning bugs are leaking out to the field where the cost of repair is exponentially higher.
2. Cyclomatic Complexity (CC)
Cyclomatic Complexity is an advanced measure of a program’s decision structure, indicating the minimum number of independent paths and the inherent testability of the code. It’s not a measure of activity, but of inherent design risk.
- The Embedded Relevance: High complexity (CC>10 to 15 in a single function is a common warning sign) correlates strongly with increased defect density and reduced testability. In constrained embedded environments, developers should aggressively refactor any function with excessive CC to ensure the system is maintainable for the entire product lifecycle, which can often span decades. High CC functions are prime targets for subtle bugs and unexpected real-time behavior due to complex, untested paths.
Phase II: The Real-Time Imperative – Determinism and Jitter Metrics
For any embedded system running an RTOS or managing a time-critical physical process, average CPU load is a vanity metric. What truly matters is determinism—the guarantee that a critical task will always finish on time.
3. Task Deadline Miss Rate (DMR)
This is the most direct and crucial metric for real-time systems. Instead of looking at average CPU usage, we look at the scheduler’s performance.
- Metric: The percentage of critical tasks that fail to complete execution before their pre-defined deadline.
DMR=Total Task ActivationsNumber of Deadlines Missed×100% - The Embedded Relevance: This metric directly flags a system’s ability to meet its functional requirements. In a Hard Real-Time system, the DMR must be 0.00%. Even in Soft Real-Time systems (like media streaming), a high DMR means a poor user experience. Low CPU load can be misleading; a high-priority task might be preempted by excessive interrupts or delayed by a blocking call, leading to deadline misses even if the average load is low.
4. Interrupt and Task Latency/Jitter
Latency is the time taken to respond to an event (like an interrupt). Jitter is the variation in that response time. Measuring both moves beyond simple CPU time to quantify the system’s real-world responsiveness.
- Metrics:
- Maximum Interrupt Latency: The absolute longest time between a peripheral signal asserting an interrupt line and the first instruction of the Interrupt Service Routine (ISR) executing.
- Maximum Task Latency (Response Time): The absolute longest time between a task being ready to run (e.g., an RTOS message arriving) and the scheduler actually starting its execution.
- The Embedded Relevance: This data identifies resource contention—such as excessively long non-preemptible code sections, interrupt handlers that take too long, or priority inversion issues—that a CPU load graph would never reveal. Modern trace tools (like Segger SystemView or Percepio Tracealyzer) are essential for visualizing and quantifying this jitter, allowing engineers to tune their RTOS kernel and synchronization primitives for absolute worst-case execution time (WCET).
5. Memory High-Water Mark (HWM) and Fragmentation Index
While not a speed metric, memory usage is a critical real-time performance indicator, particularly for heap-allocated memory.
- Memory High-Water Mark (HWM): The maximum amount of stack and heap memory ever consumed by the system during its operation.
- Fragmentation Index: A measure of how non-contiguous the free memory is, especially in systems with dynamic memory allocation.
- The Embedded Relevance: Tracking HWM is crucial for ensuring the device doesn’t crash in a corner case or under prolonged load. It helps right-size the memory partitions, reducing cost and waste. The Fragmentation Index is vital; an otherwise healthy-looking heap might be unusable if the free space is scattered into tiny, non-contiguous chunks, leading to catastrophic runtime failures during an attempt to allocate a large buffer. This is especially critical in systems that run for extended periods without reboot.
Phase III: Resource and Hardware Interaction Metrics
Embedded systems are defined by their constraints. The following metrics focus on the tight integration between hardware and software, moving beyond core logic to system-level optimization.
6. Energy Consumption per Operation (E/Op)
In battery-powered or heat-sensitive applications, power consumption is the single most critical constraint. Simply measuring total power draw over time is a blunt instrument.
- Metric: The amount of energy (Joules or mJ) consumed to perform a single, critical unit of work (e.g., ‘mJ per sensor reading’, ‘mJ per transmitted network packet’, or ‘mJ per control loop iteration’).
E/Op=Number of Operations PerformedTotal Energy Consumed - The Embedded Relevance: This metric directly ties code changes to battery life and thermal budget. It encourages engineers to optimize power management features like Dynamic Voltage and Frequency Scaling (DVFS), different sleep modes, and peripheral trigger chaining (which allows peripherals to interact without waking the power-hungry CPU). A slight increase in E/Op can translate to hours of lost battery life in the field, making this a direct driver of customer satisfaction and product cost.
7. Hardware Abstraction Layer (HAL) Latency
In modern designs, the firmware often sits atop a HAL, which abstracts the specific hardware details. The efficiency of this abstraction layer is a quality metric.
- Metric: The average and maximum execution time of key HAL functions (e.g., HAL_SPI_Transfer(), HAL_ADC_Read()).
- The Embedded Relevance: Slow HAL functions are common performance bottlenecks. By measuring the overhead introduced by the abstraction layer, engineers can decide whether to spend time optimizing the HAL, bypass it entirely for a specific critical path, or focus on a more efficient hardware peripheral for the next design iteration. This quantifies the “cost” of portability and abstraction, ensuring that architectural decisions don’t inadvertently compromise real-time performance.
Phase IV: Project and Team Flow Metrics (DORA Metrics)
Embedded project leads need visibility not just into the code, but into the process of creating that code. These metrics, popularized by the DevOps Research and Assessment (DORA) team, reveal the health and efficiency of the engineering workflow, adapted for the unique challenges of embedded development.
8. Cycle Time (CT)
Cycle Time is the single most important metric for project predictability and delivery speed.
- Metric: The total time elapsed from the first commit to a branch until that code is successfully deployed to a stable testing environment (or the final target hardware).
- The Embedded Relevance: A long cycle time indicates friction, often in non-coding steps: slow code review, long integration testing periods on limited Hardware-in-the-Loop (HIL) benches, or excessive time waiting for a custom build. The goal is to reduce CT, allowing for faster feedback loops and smaller, less risky releases. In embedded systems, this is a proxy for how quickly you can iterate on physical prototypes.
9. Mean Time To Recovery (MTTR)
Reliability is not just about avoiding failure; it’s about recovering from it quickly.
- Metric: The average time it takes to restore a system to normal operation after a failure occurs in a production or deployed environment.
- The Embedded Relevance: A low MTTR indicates effective diagnostics, robust logging (even on constrained platforms), working Over-The-Air (OTA) / Firmware-Over-The-Air (FOTA) update mechanisms, and a clear incident response process. For mission-critical embedded systems, a low MTTR (minutes, not days) is paramount to minimize downtime and ensure safety and compliance.
10. Change Failure Rate (CFR)
This metric directly ties delivery speed to quality.
- Metric: The percentage of software changes (e.g., releases, deployments, or firmware updates) that result in a failure that requires immediate remediation (e.g., a rollback, an emergency fix, or a field-reported bug).
CFR=Total Number of DeploymentsNumber of Failed Deployments×100% - The Embedded Relevance: A low CFR (typically below 10%) proves that your automated testing, hardware simulation, and release processes are robust. A high CFR suggests you are deploying too fast without sufficient quality gates, which can quickly erode team confidence and customer trust. Given the expense of physical recalls and truck rolls for embedded devices, a high CFR can be a fatal business flaw.
Conclusion: The Metrics Mindset
The modern embedded system is a labyrinth of hardware, real-time constraints, security requirements, and unforgiving physics. Relying solely on CPU load and code coverage is like navigating that labyrinth with only a compass.
By embracing metrics like Defect Removal Efficiency, Task Deadline Miss Rate, and Energy Consumption per Operation, we shift our focus from mere functionality to guaranteed quality, determinism, and efficiency. These data points empower engineering leads to make informed, defensible trade-offs between cost, performance, and risk—the three pillars of embedded design.
Stop measuring only the obvious. Start measuring what truly matters. Your next generation of high-reliability, low-power devices depends on it.
Accelerate Your Embedded Team
Ready to build a metrics-driven engineering team? RunTime Recruitment connects elite embedded engineers and technical leads with forward-thinking companies that prioritize quality and performance.
Connect with RunTime Recruitment today to find your next project or your next top-tier hire.