The emergence of RISC-V as an open standard instruction set architecture (ISA) marks a significant shift in the computing landscape, fostering innovation and customization in processor design. However, RISC-V’s open-source nature and diverse ecosystem pose unique challenges in debugging applications. Let’s discuss the methodologies and tools necessary for the effective debugging of RISC-V applications, emphasizing software debugging tools and techniques for hardware debugging, tailored for professionals well-versed in technological nuances and industry trends.
The RISC-V Ecosystem: A Foundation for Debugging
The RISC-V ecosystem is characterized by its openness and modularity, offering the potential for customization across a wide range of applications, from embedded systems to high-performance computing. Understanding the nuances of the RISC-V ISA and its implementations is foundational to effective debugging. This includes familiarizing oneself with the various extensions and custom instructions that may be employed in a specific RISC-V processor, as these aspects critically influence the selection and configuration of debugging tools.
Software Debugging in RISC-V: Tools and Strategies
Leveraging GDB in the RISC-V Context
The GNU Debugger (GDB) is integral to debugging RISC-V software applications, offering functionalities for setting breakpoints, inspecting variables, and navigating through the code execution flow. For RISC-V, a specialized version of GDB is required to address the architectural specifics. Effective use of GDB with RISC-V involves:
- Installation and Configuration: Ensuring the RISC-V specific GDB version is correctly installed and configured to interface with the target RISC-V environment.
- Cross-Compilation with Debug Symbols: The application must be compiled using the RISC-V GCC toolchain with debug symbols enabled (-g flag), facilitating detailed inspection of code execution.
- Target Connection: Establishing a connection to the RISC-V target, whether it be a hardware device or an emulator like QEMU, is achieved through a GDB server or direct interface, enabling real-time debugging.
OpenOCD for RISC-V: Bridging Software and Hardware
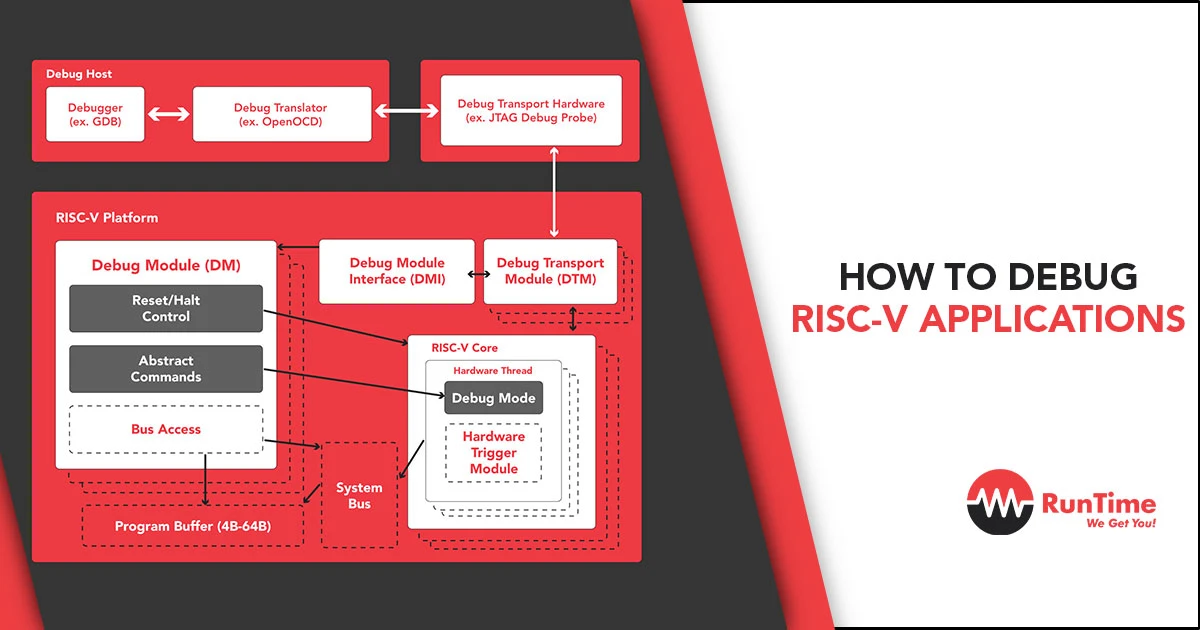
OpenOCD plays a pivotal role in interfacing GDB with RISC-V hardware, enabling programming and debugging over JTAG or similar protocols. Configuring OpenOCD with the correct interface configuration file for the specific RISC-V hardware in use is critical for successful interaction, enabling tasks such as flashing firmware, setting breakpoints, and inspecting memory and registers on the actual hardware.
The Role of Spike in Early-Stage Debugging
Spike, the official RISC-V ISA simulator, provides an invaluable tool for software debugging, especially in the early stages of development. By simulating RISC-V binaries, Spike allows for detailed inspection of instruction execution and behavior without the need for physical hardware, facilitating the identification and rectification of logical errors in algorithms or code implementation.
Hardware Debugging Techniques for RISC-V Systems
Debugging RISC-V hardware presents its own set of challenges, requiring a combination of analytical techniques and the use of specialized tools.
Navigating the RISC-V Debug Specification
The RISC-V Debug Specification outlines standardized interfaces for debugging, including but not limited to, external debug support (EDS) and advanced features for run-control debugging. Familiarity with this specification is essential, as it guides the use of hardware breakpoints, watchpoints, and control over the CPU’s execution flow, offering a structured approach to hardware debugging.
Employing Hardware Tracing and Logic Analyzers
Hardware tracing tools and logic analyzers are indispensable for real-time observation of system behavior, capturing data and control flow at critical points within the RISC-V system. These tools facilitate the identification of timing issues, data corruption, and other hardware-related anomalies. Effective debugging involves:
- Utilizing Trace Decoders: Decoding the captured trace data with tools that understand RISC-V specific trace formats.
- Integrating with Software Debuggers: Correlating hardware trace data with source code within software debuggers enhances the debugging process, providing a holistic view of system behavior.
The Advantage of Custom Debugging Modules
The open-source nature of RISC-V allows for the integration of custom debugging modules into the processor design, offering tailored insights into system behavior. These modules can range from simple logging mechanisms to complex performance counters or hardware monitors, providing deep visibility into the system’s inner workings, which is particularly beneficial for identifying and resolving elusive hardware issues.
Best Practices for Effective RISC-V Debugging
- Adopt a Holistic Testing Strategy: Combining unit tests, integration tests, and full system simulations ensures a comprehensive coverage of potential issues across software and hardware domains.
- Leverage Community Knowledge and Documentation: The RISC-V community is a rich resource for troubleshooting insights and best practices, offering documentation, forums, and user experiences that can aid in resolving complex debugging scenarios.
- Stay Informed and Adaptive: The RISC-V ecosystem is rapidly evolving, with new tools, extensions, and methodologies emerging regularly. Staying informed about these developments is crucial for maintaining an effective debugging workflow.
Key Takeaways
Debugging RISC-V applications requires a meticulous and informed approach, balancing specialized software tools with techniques tailored to hardware analysis. By leveraging tools such as GDB, OpenOCD, and Spike, alongside a thorough understanding of the RISC-V Debug Specification and the use of hardware tracing instruments, developers can navigate the complexities of RISC-V debugging. The adoption of custom modules and a commitment to continuous learning and adaptation further enhance the debugging process, ensuring robust and efficient RISC-V application development.
Hire the Best Engineers with RunTime Recruitment
If you’re searching for highly skilled engineers worldwide, our expert team of engineers-turned-recruiters is here to help you. We offer in-depth knowledge of technical recruiting in the engineering industry to make the sourcing process much easier for you.
On the other hand, if you’re an engineer looking for new opportunities, RunTime Recruitment’s job site is the perfect place to find job vacancies.