
Flaky Hardware, Flaky Tests: Decoupling Firmware Bugs from Testbench Artifacts in HIL Environments
15 July 2026 · Lance Harvie
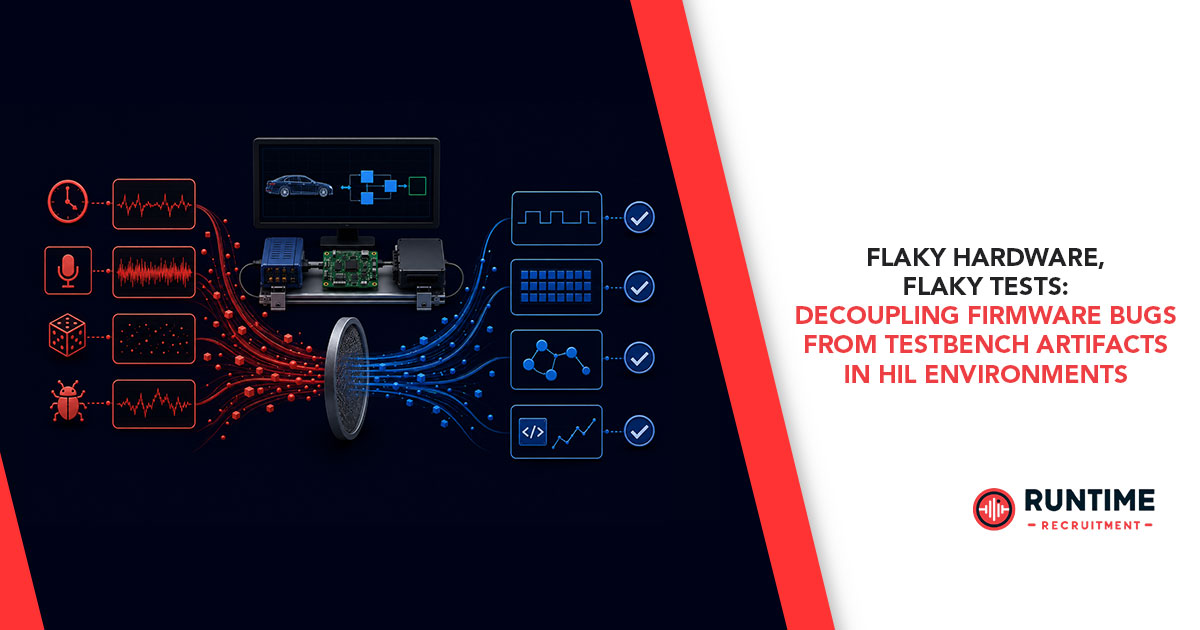
Flaky Hardware, Flaky Tests: Decoupling Firmware Bugs from Testbench Artifacts in HIL Environments
Few moments in an embedded systems engineer’s week match the frustration of a flaky test in a Hardware-in-the-Loop (HIL) environment. It is 3:00 AM, the Continuous Integration (CI) pipeline stalls, and a critical nightly regression test fails. The error log indicates a timeout on a Controller Area Network (CAN) message response from the electronic control unit (ECU). You rerun the test pipeline manually. It passes. You run it ten more times; it passes nine times and fails once more.
Now the engineering dilemma begins: Is this an elusive race condition in the real-time operating system (RTOS) task scheduling, or did a mechanical relay in the HIL fault injection unit bounce a fraction of a millisecond too long?
In complex embedded systems across automotive, aerospace, medical, and industrial automation fields, HIL testing is the gold standard for validation. However, because HIL sits at the volatile intersection of physical instrumentation, simulated environments, and target execution hardware, it is uniquely prone to non-deterministic failures. When a test fails intermittently, distinguishing between a legitimate firmware bug and a testbench artifact can consume days of development time.
Decoupling these two domains requires a deep understanding of the physical and architectural vectors that introduce flakiness into HIL environments, along with a systematic framework for triage.
1. The Anatomy of an HIL Testbench: Where the Flakiness Hides
To understand how testbench artifacts mimic firmware bugs, we must first look at the physical and electrical architecture of a typical HIL rig. An HIL test setup is not merely a software test runner execution environment; it is a complex, multi-layered cyber-physical system.

An HIL setup generally comprises:
The Host PC/CI Engine: Runs high-level test orchestration scripts (e.g., Python, Robot Framework, Vector CANoe).
The Real-Time Simulator: Executes plant models of the physical world (e.g., an internal combustion engine, a hydraulic actuator, or a battery pack) at deterministic step sizes, often under 100 μs.
Signal Conditioning & Fault Injection Units (FIUs): Operational amplifiers, digital-to-analog converters (DACs), and mechanical or solid-state relays that mimic real-world electrical faults like short-to-ground or open-circuit conditions.
The Physical Wire Harness: Bundles of cabling connecting the HIL I/O interfaces to the pins of the target device.
The Device Under Test (DUT): The actual embedded microcontroller, FPGA, or SoC running the production firmware.
Every boundary layer in this architecture introduces a potential point of failure. A failure in the signal conditioning layer can perfectly mimic an input driver failure on the DUT. A timing jitter in the simulation model step can show up as an apparent communication timeout in the firmware.
2. Common Testbench Artifacts Misdiagnosed as Firmware Bugs
Testbench artifacts are false-positive test failures caused by imperfections, misconfigurations, or degradations in the testing infrastructure itself. Below are the primary culprits that frequently send firmware developers down rabbit holes.
Signal Integrity and Physical Layer Degradation
Unlike pure Software-in-the-Loop (SIL) environments, HIL systems are subject to Maxwell’s equations.
Ground Loops: If the HIL simulator chassis and the DUT power supply are tied to different ground references with subtle potential differences, return currents can flow through signal lines. This introduces common-mode noise that can corrupt analog sensor inputs or trip low-voltage thresholds on digital lines.
Improper Termination: High-speed communication buses like CAN, CAN FD, or RS-485 require precise termination resistance (120 Ω). Over time, as wire harnesses are modified, connectors loosen, or terminal blocks decay, the bus impedance shifts. This causes signal reflections that intermittently corrupt data frames, manifesting as sporadic bus errors or missing frames that look like firmware stack starvation or interrupt handling failures.
Parasitic Capacitance in Long Wiring Harnesses: Wire harnesses in industrial HIL racks can span several meters. The resulting parasitic capacitance slows down the rise and fall times of fast digital protocols like SPI or I2C. A firmware driver that runs flawlessly on a desktop development board may fail on the HIL rig because the clock edges have softened into sinusoids.
Timing Jitter in the Real-Time Simulator and Test Script Interface
One of the most insidious testbench artifacts stems from a misunderstanding of execution domains. Test scripts running on a standard Windows or Linux host PC operate in a non-deterministic, time-sliced environment. If a test script relies on host-side timing to validate an embedded event, flakiness is guaranteed.
For example, consider a Python test script that sends a command to the DUT over UART and expects a response pin to toggle within 5 ms:

If the host operating system decides to execute a background process or thread context switch during time.sleep(0.005), the actual sleep duration might stretch to 12 ms. The firmware might have toggled the pin exactly on time and cleared it, but the host-side script missed the window. The test report logs a failure, pointing the finger at the firmware's execution determinism when the culprit was the host's lack of real-time scheduling.
Mechanical Relay Bounce and Settling Times
Fault Injection Units (FIUs) often use mechanical relays to simulate open circuits or shorts to power lines. When a test script commands an FIU relay to close, the mechanical contacts inside the relay bounce repeatedly for several milliseconds before establishing a stable electrical connection.
If the firmware is designed to detect edge-triggered interrupts (e.g., a critical safety e-stop button), it will register this relay bounce as multiple ultra-fast button presses. If the firmware's software debouncer is not tuned to handle the specific profile of the HIL's mechanical relays, the system may trip an error state. Developers will search the codebase for an unhandled edge case, ignoring the fact that the physical button on the actual product uses a solid-state switch or a different hardware debounce filter entirely.
3. Real Firmware Bugs Misdiagnosed as Testbench Flakiness
Conversely, the complexity of the HIL setup can lead to a dangerous complacency known as "testbench fatigue." Engineers encounter so many false positives due to wiring or script errors that when a real, low-probability firmware bug surfaces, they dismiss it as a testbench artifact and hit "re-run."
HIL environments are uniquely capable of exposing deep architectural bugs in firmware precisely because they introduce realistic, non-deterministic environmental variation.
Race Conditions Triggered by Physical Asynchrony
In a pure simulation or desktop debugging environment, events often occur in perfect alignment with the CPU clock or system ticks. On an HIL rig, true physical independence returns.
An external sensor emulator updates its register via an I2C bus at a rate completely asynchronous to the internal processing loop of the DUT.
If the firmware lacks appropriate synchronization primitives (such as mutexes, semaphores, or volatile atomic operations), a shared memory buffer can become corrupted.
Because the phase alignment between the external peripheral's clock and the internal CPU clock shifts by fractions of a microsecond on every test run, this race condition might only manifest once every few hundred cycles. It is a genuine production bug that will cause field failures, but its statistical rarity causes it to look exactly like a flaky testbench relay or wire harness drop.
Interrupt Service Routine (ISR) Starvation and Latency Traps
HIL setups allow for full-load testing, where CAN, Ethernet, and analog channels are saturated simultaneously to mimic worst-case operating environments. Under these conditions, the firmware's interrupt architecture is pushed to its absolute limit.
If an engineer designs an ISR that performs complex logic or long memory copies rather than offloading the workload to a deferred task or thread, the system may run fine under nominal desktop testing. However, when subjected to the high-density traffic generated by an HIL plant model, the microcontroller enters interrupt nesting traps or suffers from ISR starvation.
Nominal Load:
[ISR 1] ---> [RTOS Thread] ---> [ISR 1] ---> [RTOS Thread] (System Happy)
HIL Saturated Load:
[ISR 1] -> [ISR 2] -> [ISR 3] -> [Nested ISR 1] ... [RTOS Thread Starved!] (Timeout Triggered)
When a timeout occurs under these conditions, the immediate reaction might be to blame the HIL simulator for generating too many messages too quickly. In reality, the HIL is performing its exact intended function: exposing an architectural bottleneck in the firmware's real-time scheduling design.
4. A Systematic Triage Framework for HIL Failures
To stop wasting engineering hours guessing where a fault lies, engineering teams must implement a structured, deterministic triage matrix when an intermittent failure occurs.

Step 1: Establish Environment Isolation (SIL vs. HIL Comparison)
The first step in isolating a failure is to move down the testing pyramid. Can the intermittent failure be reproduced in a Software-in-the-Loop (SIL) environment or via a pure software instruction-set simulator?
If the failure occurs in SIL with identical test inputs, the issue is entirely algorithmic or logical. The physical HIL layer can be completely ruled out.
If the failure only occurs on the HIL rig, the problem is constrained to the interaction between the physical silicon, the real-time scheduling of the RTOS, and the electrical interfaces.
Step 2: Implement Loopback Testing and Self-Diagnostics on the HIL Rig
Before checking the DUT firmware, verify the integrity of the test instrument. Modern HIL rigs should feature automated self-test and loopback routines.
Disconnect the wire harness from the DUT and route the HIL’s analog and digital outputs directly back into its own inputs (loopback configuration).
Run an automated diagnostic script that exercises every DAC, ADC, digital I/O, and communication channel across its full dynamic range.
If any signal degradation, unexpected attenuation, or message drop is observed during loopback, the hardware testbench is faulty. This points directly to a failing cable, dirty connector contacts, or an uncalibrated instrument module.
Step 3: The Golden Device Strategy
Always keep a designated "Golden Device"—a production-grade ECU running a highly stable, thoroughly verified reference version of the firmware—near the HIL rack.
When an unexplainable intermittent failure surfaces on a development branch, swap the current DUT with the Golden Device.
Run the problematic test suite against the Golden Device several hundred times.
If the Golden Device fails in the exact same manner, the root cause is almost certainly a testbench artifact or a regression in the test script itself. If the Golden Device passes consistently, the issue is isolated to the new code changes in the production firmware under development.
Step 4: Synchronized Hardware Telemetry and Deep Trace Analysis
If steps 1 through 3 indicate that the firmware is failing under real-world conditions, you must gain visibility into the internal states of both the DUT and the HIL simultaneously.
Relying on print statements (printf) over a serial port to debug real-time systems introduces significant probing delay, changing the timing characteristics of the firmware and often masking the very bug you are trying to find. Instead, utilize hardware-assisted, non-intrusive tracing:
Arm CoreSight / J-Trace / Nexus Tracing: Use hardware debug probes that can stream instruction trace data or variable watchpoint metrics out of the MCU without stopping the CPU or introducing software overhead.
Instrumented Testbench Scope Traps: Configure an external mixed-signal oscilloscope or logic analyzer to act as an objective third party. Use a spare GPIO pin on the DUT as an "execution marker." Toggle this pin when entering critical ISRs or task loops. Simultaneously, monitor the physical communication lines (CAN, SPI) and the HIL's analog injection lines.
Time-Stamp Alignment: Ensure that the HIL log file time-stamps and the logic analyzer/debug trace time-stamps are synchronized to a common clock reference or aligned via a distinctive electrical sync pulse triggered at the start of the test run. When a failure occurs, correlate the exact microsecond of the test script failure with the internal state of the firmware and the electrical reality on the wire harness.
5. Architectural Solutions for Robust HIL Testing
Eliminating flakiness entirely requires proactive, defensive engineering practices applied to both firmware architecture and test bench development.
Design Firmware with "Testability" in Mind
Firmware engineering should never treat the HIL environment as an afterthought. To maximize observability and controllability:
Expose Internal State Machine Variables: Provide a dedicated, high-speed diagnostic interface (such as a private CAN diagnostic protocol, XCP over Ethernet, or memory injection via SWD) that allows the HIL test script to read the internal states, loop execution times, and memory health parameters of the firmware in real time without interfering with normal operations.
Configurable Software Debouncers: Allow the time constants and sample thresholds of input debounce filters to be adjusted via configuration parameters. This allows the firmware to be tuned to accommodate the known, measured relay bounce characteristics of an HIL system during verification runs, without altering the underlying production logic.
Impose Strict Determinism in Test Scripts
Never use host-side OS timers (sleep(), delay()) to validate precise timing requirements. Instead, shift the responsibility for timing verification onto the real-time execution engine of the HIL platform.
If a response must occur within 5 ms of a stimulus, configure the real-time simulator's FPGA or hard real-time processor to monitor the signal and log the delta-time at the hardware layer.
The host-side Python script should simply query the real-time engine after the test step completes: was_timing_requirement_met(). This decouples the non-deterministic execution of the PC operating system from the verification metric.
Maintain Detailed Wire Harness and Relay Profiles
Treat the physical components of the HIL rig as assets under strict configuration control.
Document and track the total number of actuation cycles on mechanical fault injection relays. Relays have a finite operational life (typically 105 to 106 operations). Implement software counters within your test execution framework to alert lab technicians when a relay module is approaching its wear-out phase and needs replacement.
Enforce periodic automated calibration cycles for all analog I/O lines to compensate for thermal drift and component aging within the HIL instrumentation cards.
Conclusion
Decoupling firmware bugs from testbench artifacts in an HIL environment is ultimately a battle for deterministic clarity. By treating the test bench not as a pristine oracle, but as a complex cyber-physical system subject to noise, wear, and timing variability, embedded engineers can systematically eliminate the false positives that derail timelines.
Implementing a rigorous triage strategy—leveraging environment isolation, loopback diagnostics, golden devices, and synchronized hardware telemetry—ensures that when a test fails, you know exactly where to point the soldering iron or the debugger. The result is a rock-solid, trustworthy automated validation pipeline that accelerates time-to-market and ensures absolute product safety in the field.
Building Your Next-Generation Embedded Team?
Developing robust firmware that plays nicely with complex HIL environments requires elite talent—engineers who understand both the abstract world of real-time software architecture and the physical realities of electrical engineering.
If you are looking to scale your engineering team with top-tier embedded systems developers, firmware architects, or HIL verification specialists in Australia or globally, look no further than RunTime Recruitment. We specialize in pairing cutting-edge technical firms with the brightest minds in the hardware and embedded software domains.
Connect with RunTime Recruitment today to find the specialized talent you need to build future-proof, bulletproof embedded systems.