
The Emulation Trap: Why QEMU and Software Simulators Miss Hardware-Level Timing Glitches
14 August 2026 · Lance Harvie
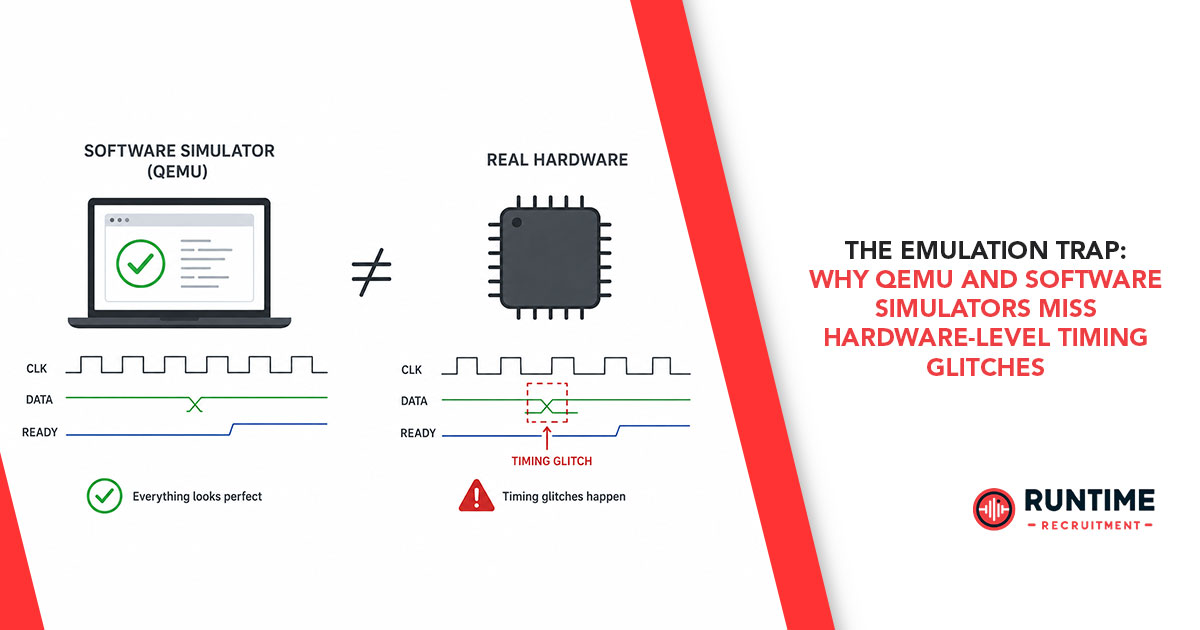
Every embedded systems engineer has experienced a version of this nightmare: your firmware builds cleanly, passes every unit test in a QEMU-based Continuous Integration (CI) pipeline, and executes seamlessly across millions of virtualized instruction cycles. Confident in the stability of the build, you flash the binary onto target silicon. Within hours—or worse, under heavy thermal throttling in field testing—the system locks up, corrupts a DMA buffer, or drops critical CAN bus frames.
Welcome to the Emulation Trap.
Virtual platforms like QEMU, Renode, and OVPSim are modern engineering marvels. They enable shift-left software development, allowing firmware teams to architect application logic, integrate RTOS kernels, and run automated regression suites long before physical silicon leaves the fab. However, a dangerous misconception persists across modern engineering organizations: confusing functional instruction equivalence with temporal microarchitectural accuracy.
Software emulators were designed for execution throughput, not cycle-accurate physical modeling. When firmware depends on precise peripheral register timing, memory bus ordering, cache line invalidations, or hardware interrupt propagation, relying exclusively on software virtualization introduces systemic blind spots. Understanding the internal mechanics of software emulation reveals why software simulators miss hardware-level timing glitches—and how to engineer a verification pipeline that catches them before production.
1. The Architecture of Illusion: How QEMU Executes Code
To understand why software simulators miss hardware timing anomalies, you must first examine how they process machine code.
At its core, QEMU is a functional emulator powered by a Dynamic Binary Translation (DBT) engine known as the Tiny Code Generator (TCG). TCG takes guest target instructions (e.g., ARM64, RISC-V, or Xtensa assembly), converts them into an Intermediate Representation (IR), optimizes the IR, and compiles native host machine instructions (e.g., x86_64) on the fly.
+---------------------------------------+
| Guest Code (ARM / RISC-V) |
+---------------------------------------+
|
v
+-----------------------------------+
| TCG Intermediate Rep. |
+-----------------------------------+
|
v
+------------------------------------------+
| Host Code (x86_64 Execution) |
+------------------------------------------+
Instruction Counting vs. Cycle Counting
QEMU does not model clock cycles, pipeline stages, branch predictors, or memory bus wait-states. By default, TCG executes translated blocks as fast as the host CPU thread can run them.
Even when configured with instruction-counting mode (-icount), QEMU merely enforces a deterministic relationship between executed instructions and virtual time. It assigns a fixed quantum of virtual time (e.g., 1 instruction=10 ns).
On physical target hardware, instruction execution time is non-deterministic:
An LDR instruction executing from L1 Data Cache might take 1 clock cycle.
The same LDR triggering an L2 Cache miss takes 15 to 20 clock cycles.
The same LDR stalled behind an active AXI DMA burst transaction might take 120+ clock cycles.
In QEMU, every LDR advances virtual time by the exact same unit, completely flattening microarchitectural temporal variance.
Host Scheduler Dominance
When running Multi-Threaded TCG (MTTCG) or KVM-accelerated virtual environments, guest virtual CPUs (vCPUs) are mapped directly to OS threads on the host machine. The sequence and timing of inter-core execution are dictated by the host operating system’s kernel scheduler (Linux CFS or Windows thread scheduler). The host CPU’s cache state, thermal boosting, and background process workload directly dictate when vCPU threads execute. The virtual platform cannot mirror the cycle-synchronized inter-core clock relationships of physical System-on-Chip (SoC) interconnects.
2. The Four Fatal Gaps: Where Software Simulators Fall Short
Software virtualization hides the messy physical realities of silicon. Four hardware mechanisms routinely bypass QEMU and software simulators, manifesting as fatal timing glitches on real hardware.
+-----------------------------------------------------------------------------------------+
| THE FOUR FATAL TIMING GAPS IN EMULATION |
+-----------------------------------------------------------------------------------------+
| 1. Memory Hierarchy & Barrier Violations (Weak vs. Strong TSO) |
| 2. Bus Contention & Interconnect Arbitration Delays |
| 3. Peripheral State Machine Latency & Register Read-Modify-Write |
| 4. Deterministic Interrupt Latency vs. Translation Block Bounds |
+-----------------------------------------------------------------------------------------+
Gap 1: Memory Hierarchy, Cache Dynamics, and Out-of-Order Execution
Modern embedded processors (such as ARM Cortex-A series or high-performance RISC-V cores) employ weakly-ordered memory models. To maximize pipeline efficiency, the CPU and memory bus controller can reorder memory reads and writes.
To enforce strict sequencing—for example, ensuring a data payload is fully written to RAM before setting a "data ready" flag in a peripheral register—developers must insert memory barrier instructions (DMB, DSB, ISB in ARM; FENCE in RISC-V).
The Trap:
When running QEMU on an x86_64 host computer, the underlying physical processor enforces a Total Store Order (TSO) memory model in hardware. Writes are never reordered with other writes. Consequently, if an embedded engineer forgets to place a DMB memory barrier in a ring-buffer driver:
In QEMU (on x86 host): The host hardware implicitly enforces memory ordering. The test suite passes 100% of the time.
On Physical Target Silicon (ARM/RISC-V): The target core writes the "data ready" flag out of order before the payload hits main memory. The DMA controller or peer core reads garbage data, causing silent buffer corruption.
Gap 2: Bus Contention, DMA Starvation, and Interconnect Arbitration
On a physical SoC, the CPU core, DMA controllers, Ethernet MAC, and GPU share multi-master interconnect buses (such as ARM AXI, AHB, or Wishbone). Bus matrix arbiters use round-robin, fixed-priority, or weighted-fair-queuing algorithms to resolve simultaneous memory requests.
If an embedded vision peripheral triggers a massive multi-beat DMA transfer across the system bus, the CPU core experience memory bus stalls. An instruction fetch or stack access halts for multiple clock cycles.
The Trap:
QEMU models Memory-Mapped I/O (MMIO) registers as synchronous C function callbacks. When guest code executes a store to an MMIO register address:
TCG pauses execution.
QEMU instantly invokes the internal C function simulating the peripheral model.
The C function updates internal emulator state variables in zero virtual time.
TCG resumes guest code execution.
There is no concept of bus arbitration, crossbar saturation, or DMA memory access collision. Code that relies on implicit execution speed to outrun a DMA transfer will succeed in simulation but suffer severe memory starvation and dropped packets on target silicon.
Gap 3: Peripheral State Machine Latency and Register Read-Modify-Write Races
Hardware peripherals are autonomous finite state machines (FSMs) running on dedicated clock domains, often decoupled from the core CPU clock via synchronizer flip-flops.
Consider a standard Clear-on-Write (W1C) or Clear-on-Read status flag in a high-speed SPI or UART peripheral:
// Typical Peripheral Flag Clearing Sequence
uint32_t status = SPI1->SR; // Read Status Register
if (status & SPI_SR_RXNE) {
uint8_t data = SPI1->DR; // Clear-on-Read action
process_byte(data);
}
In physical silicon, when the CPU reads SPI1->DR, the clear-on-read signal must propagate through a synchronizer chain operating on the peripheral clock domain (2–3 peripheral cycles) before the RXNE hardware line drops. If the CPU clock is running at 400 MHz while the peripheral clock operates at 12 MHz, a tightly unrolled loop or an immediate re-inspection of the status register will read a stale active flag, leading to duplicate processing.
The Trap:
In QEMU, reading SPI1->DR executes an instant state updates in host C code. The status flag clears within the exact same virtual instruction boundary. The emulator obscures propagation delays, masking severe race conditions that break firmware on actual hardware.
Gap 4: Deterministic Interrupt Latency vs. Translation Block Boundaries
Real-time embedded applications depend on predictable interrupt response times. Hardware interrupt processing involves deterministic microarchitectural steps:
Pipelined interrupt sampling.
Vector table lookup.
Hardware context stacking (e.g., pushing registers R0-R3, R12, LR, PC, xPSR onto the stack in ARM Cortex-M).
Pipeline flushing and branch target entry.
This sequence takes a fixed, known number of clock cycles (e.g., exactly 12 cycles on a Cortex-M4).
The Trap:
In QEMU's TCG engine, interrupts are sampled primarily at Translation Block (TB) boundaries. A Translation Block is a basic block of assembly code ending in a jump, call, or conditional branch.
If guest firmware enters a long, unrolled mathematical calculation or a tight loop within a single Translation Block, QEMU cannot inject a pending hardware interrupt until the entire block finishes executing.
Platform
Interrupt Ingestion Mechanism
Temporal Behavior
Physical Silicon
Preempts execution mid-instruction cycle
Fixed, deterministic clock-cycle latency
QEMU (TCG)
Defer until active Translation Block exits
Variable latency causing massive virtual jitter
This introduces artificial, unpredictable interrupt jitter in simulation while failing to test true hardware edge cases—such as an interrupt firing in the middle of a multi-word atomic memory update.
3. The Illusion of Green: Why CI/CD Pipelines Mask Critical Vulnerabilities
Modern firmware organizations heavily rely on automated CI/CD pipelines running thousands of headless QEMU containers. While this approach effectively catches high-level logical bugs, protocol framing errors, and state machine design flaws, it creates a false sense of security: The Illusion of Verification.
When a pull request passes 10,000 virtualized integration tests, engineering teams often feel confident releasing the code. However, when timing-sensitive code hits production silicon, latent bugs emerge as non-deterministic Heisenbugs—failures that occur only under specific thermal conditions, precise memory bus loads, or rare interrupt interleavings.
+------------------------------------------------------------------------------+
| THE COST OF TIMING BUGS |
+------------------------------------------------------------------------------+
| Stage Identified | Diagnostic Tool | Relative Cost |
+-------------------------------+-------------------------+-------------------+
| Virtual Platform (QEMU) | Software Debugger | 1x |
| Hardware-in-the-Loop (HIL) | Logic Analyzer/Trace | 10x |
| Production Field Deployment | Telemetry / FOTA | 1000X |
+--------------------------------------------------------------------------------+
A memory race condition caught on a developer's desktop costs minutes to fix. The same bug discovered during field testing requires expensive debugging with logic analyzers, custom hardware trace units, and emergency Field Firmware Over-The-Air (FOTA) updates.
4. Bridging the Gap: A Modern, Hybrid Verification Strategy
Avoiding the Emulation Trap does not mean abandoning QEMU or software simulators. Instead, engineering teams must correctly define their place within a multi-tiered verification hierarchy. Simulators excel at functional acceleration, but physical validation remains essential.
+----------------------------------------------+
| Tier 1: Functional Simulation |
| (QEMU, Renode) |
| High speed, low timing accuracy |
+---------------------------------------------+
|
v
+--------------------------------------------+
| Tier 2: Cycle-Approximate Sim |
| (Verilator, Gem5, SystemC) |
| Medium speed, high RTL fidelity |
+-----------------------------------+
|
v
+-------------------------------------------+
| Tier 3: Hardware-in-the-Loop |
| (Target Boards + Test Benches) |
| Real silicon, true physical time |
+-------------------------------------------+
Tier 1: Functional Emulation (QEMU / Renode)
Primary Role: Developer inner-loop iteration, high-level business logic, API validation, protocol stack parsing, and application-layer unit testing.
Goal: Maximize execution speed and developer feedback loops.
Tier 2: Microarchitectural & Cycle-Approximate Simulation (Verilator / Gem5 / SystemC)
Primary Role: Low-level driver development, custom memory controller verification, and custom hardware accelerator co-design.
Goal: Verify hardware/software interfaces using compiled RTL or full system microarchitecture models where cycle accuracy is strictly required.
Tier 3: Automated Hardware-in-the-Loop (HIL) Testing
Primary Role: Final validation before production releases.
Goal: Mount target microcontrollers or SoCs onto automated test racks integrated directly with CI runners.
By coupling real target boards with programmable power supplies, relay control boards, hardware trace probes (e.g., Lauterbach TRACE32, SEGGER J-Trace), and logic analyzers (Saleae), teams can run stress tests under actual hardware conditions:
Voltage Corner Testing: Intentionally drop core supply voltages to trigger low-power state transitions and clock switching races.
Bus Saturation Stressing: Inject high-frequency DMA network traffic while hammering core inter-process communication (IPC) channels.
Thermal Throttling Validation: Run tests while cycling target temperature to expose clock domain synchronizer failures under thermal load.
Conclusion: Respecting the Physical Boundary
Software emulation remains one of the most powerful paradigms in modern embedded systems engineering. It breaks hardware dependencies, accelerates release cadence, and democratizes test automation.
However, QEMU and software simulators model what code should do, not how hardware physically behaves. Silicon is governed by physical reality—propagation delays, bus crossbar conflicts, cache line invalidations, and signal synchronizers.
Engineers who understand the boundary where software simulation ends and hardware physics begins build more resilient, production-ready embedded systems. Never trust a completely green virtual test suite until the binary has faced the chaotic, non-deterministic reality of physical silicon.
Connect with RunTime Recruitment
Looking to recruit top-tier embedded engineering talent or seeking your next senior role in firmware, silicon verification, or RTOS architecture? Partner with the specialist engineering recruiters at RunTime Recruitment to elevate your team today.